A Comparison of the Top Four Largest Companies by Market Capitalization
Apple (AAPL), Microsoft (MSFT), Alphabet (GOOGL), and Amazon (AMZN). Which stock is a buy now?

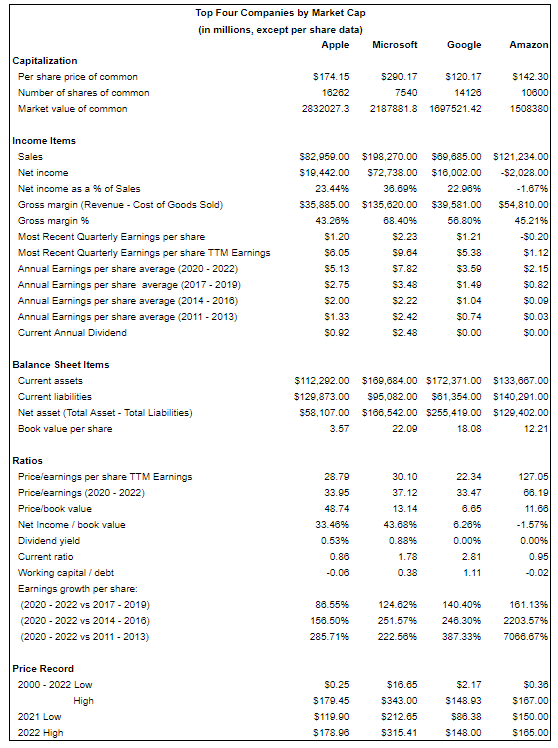
Inspired by Benjamin Graham in his The Intelligent Investor book chapter 13, I compared the top four largest companies by market capitalization to form a holistic view of each company’s financial position and compare them against each other and the market as a whole.
Companies selected are Apple (AAPL), Microsoft (MSFT), Alphabet (GOOGL), and Amazon (AMZN). I took a closer look at their profitability, financial position, stability, growth, dividends, and price history.
All figures are in millions. All items listed in the income and balance sheet sections are from the companies’ most recent earnings reports (three-month ended Jun 30, 2022). The per share price is the closing price of August 18, 2022. Earnings per share data is from Macrotrends, dividend figures are from Nasdaq, and market index price-to-earnings ratio is from WSJ.
Overview
Because I am focusing on the six elements: profitability, financial position, stability, growth, dividends, and price. Let’s start with profitability.
Profitability
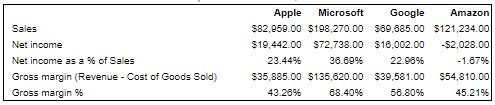
When comparing profitability, Apple and Google showed satisfactory results. Microsoft stood out from both net income and gross margin perspectives. Amazon’s net loss included a pre-tax valuation loss of $3.9 billion from common stock investment in Rivian Automotive, but even if I exclude the loss of Rivian investments, Amazon's net income was $1.9 billion, still far less than that of the other three companies.
In terms of earnings, all companies listed showed positive earnings per share for their most recent quarter, except for Amazon.
Looking at their current price/earnings ratio, Google is modestly priced at 22.23 times its trailing twelve-month (TTM) earnings as against a similar figure of 22.75 for the S&P 500 and 19.98 for Dow Jones Industrial Averages. Apple and Microsoft’s P/E ratios are 28.79 and 30.10. Amazon showed a very high multiple of 127.05 times such earnings. The explanation for the large multiple is its superior growth as illustrated later below. The loss of investing in the common stock of Rivian also lowered Amazon’s earnings for the recent quarters.
Except for Amazon, all other businesses showed satisfactory profitability results, with an especially impressive showing by Microsoft.
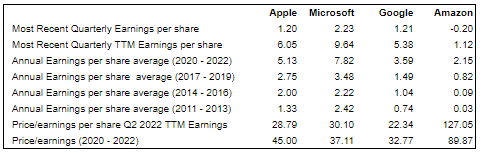
Financial Position
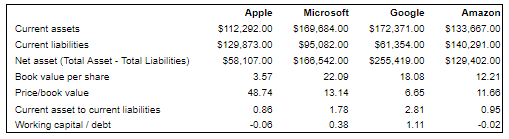
Current assets are assets that can be converted into cash within one year, while current liabilities are obligations expected to be paid within one year. Two enterprises - Microsoft and Google - have enough current assets to cover their current financial obligations. Amazon and Apple on the other hand have lower current assets than current liabilities.
All companies listed have a good amount of net assets, with Google leading the pack. All the companies have relatively low long-term debt.
Book value per share is the sum that shareholders would receive in the event that the firm is liquidated. Microsoft has the highest book value per share, but it is also priced higher compared to Google as shown in the price/book value per share.
Working capital to debt ratio reflects a company’s ability to pay off its total liabilities with only its current assets. Google has strong working capital to debt, followed by Microsoft, while Apple and Amazon both have negative working capital.
Google is in a sound financial position having a large net asset, the lowest price/book value per share, a better than the standard current ratio of 2 (current ratio is calculated as current assets minus current liabilities), and the highest working capital to debt ratio.
Stability
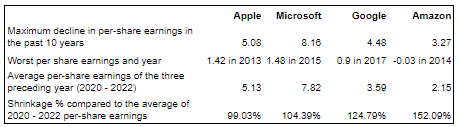
According to Benjamin Graham, “stability is measured by the maximum decline in per-share earnings in any one of the past ten years, against the average of the three preceding years”. No decline means 100% stability. All companies listed have higher shrinkages than the market. S&P 500 shrinkage is ~76.8%.
Growth
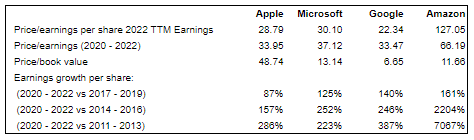
All companies listed show extraordinary earnings growth as compared to the earning growth of the S&P 500 of 27.51%, 50.98%, and 71.95% in the same period. Amazon’s figures are very impressive, but the growth is also driven by the high price/earnings ratio. Google shows a good growth rate, especially when set against its current price/earnings ratio.
Dividends
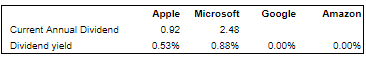
Apple has the longest dividend history, starting paying dividends in 1988 but took a pause in 1995 and resumed in 2013 and paid it up to today. Microsoft has been consistently paying dividends since 2003. Both Google and Amazon do not pay dividends.
Price History
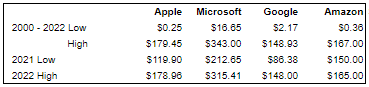
All companies listed showed impressive price advances as measured from their lowest to the highest points during the past 22 years.
Note that the S&P 500 performed ranging from 835.23 to 4,766.18. If we divide the high 4,766.18 by low 835.23, that gives us 5.7. The spread of the listed companies above has varied from 20.6 for Microsoft to 717.8 for Apple.
Conclusion
All four companies have shown impressive growth and performed significantly better than the market for the past two decades. Google and Microsoft currently are modestly priced and better financially positioned compared to the other two.
Follow me on Tiktok and Instagram!